A recent white paper (“The Association Between Drug Rebates and List Prices”) narrowly suggests an association between list prices for brand drugs and the rebate practices of pharmacy benefit managers (PBMs) and insurers, despite an underlying methodology that is notably broader and does not isolate to the role of PBMs and insurers.[1]
Click here to download the infographic.
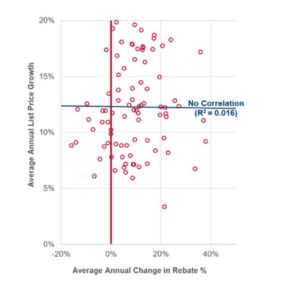
- Rising List Prices Show No Correlation with Changes in Drug Rebate Levels. Contrary to the white paper’s suggestion, statistical analysis of the top brand drugs in Medicare Part D has found no correlation (R2=0.016) between rising list prices set by drug manufacturers and the change in rebate levels that they negotiate with PBMs over the 2012-2017 period —a broader time period than that examined by the USC Schaeffer white paper.
- While Rebates May Go Up or Down, the Drug Prices Set By Manufacturers Only Go Up. The Health and Human Services (HHS) Office of Inspector General (OIG) found that PBM-negotiated rebates lead to lower prescription drug costs in the Medicare prescription drug program.[2] The OIG also found that, for more than a third of the brand-name drugs it reviewed, rebates declined as costs increased. It also found that rebates did not grow in tandem with prices, specifically stating that the majority (95.6%) of Medicare Part D brand-name drug costs increased regardless of rebates over the 5-year period examined.
- Higher Introductory Prices for New Drugs Launched with No PBM Rebates. Between 2005 and 2017, the trend for introductory prices of new prescription drugs—for which rebates are not available—increased by more than $500 each year. The USC Schaeffer white paper excluded newly launched prescription drugs.
- No PBM Rebates in Part B, Yet Extraordinary Price Increases. Conversely, in a prescription drug market—the Medicare Part B program—absent the role of PBMs and PBM-negotiated rebates, brand-name drugs have seen extraordinary price increases. For example, Miacalcin, a treatment for osteoporosis, increased 3,449% (from $461 to $16,375) between 2012 and 2017.[3]
- No PBM Rebates in Part B, Yet Prices Increased for Top Drugs. Commonly used Part B-payable drugs also have seen price increases ranging from 16% to 55%. For example, prices for Remicade, a treatment for arthritis, increased from $2,937 in 2012 to $4,561 (or 55%). The USC Schaeffer white paper excluded prescription drugs purchased through the Medicare Part B program.
- While the Paper Narrows the Drugs Examined Significantly, It Does Not Isolate to PBM-Negotiated Rebates, which “Cloud” the Results. The paper’s authors themselves note several limitations to their analysis, stating such limitations “could weaken our estimates or cloud their interpretation.” The limitations notably include that the analysis does not isolate rebates negotiated by PBMs on behalf of government programs, employers and other health plan sponsors from manufacturer payments and discounts paid to pharmacies and wholesalers and government-mandated rebates to the Federal government and states (e.g., the Medicaid Drug Rebate Program, the 340B program, Veterans Administration Federal Supply Schedule, etc.). Despite these limitations, the white paper blames the one industry that is both reducing prescription drug costs and improving quality – PBMs – for the pricing practices of prescription drug manufacturers.
- PBMs Are Lowering Drug Benefit Costs. An overwhelming body of independent research and analysis shows that PBMs are part of the solution to lowering health care costs, including research from the FTC[4], HHS OIG[5], the Congressional Budget Office[6] and the GAO.[7] Typically, PBMs reduce prescription drug costs by 30%.
- PBMs Are Driving Down Prescription Drug Costs. In 2013, the first highly effective cure for hepatitis C—a small-molecule drug—was priced at $84,000 for a cycle of treatment. By 2015, after that drug faced competition from additional market entrants, PBMs were able to negotiate a 46% rebate—saving billions.
[1] Neeraj Sood, Rocio Ribero, Martha Ryan and Karen Van Nuys. USC Leonard D. Schaeffer Center for Health Policy & Economics. The Association Between Drug Rebates and List Prices. February 2020.
[2] U.S. Department of Health & Human Services Office of Inspector General. Rebates for Brand-Name Drugs in Part D Substantially Reduced the Growth in Spending from 2011 to 2015 (OEI-03-19-00010). September 2019. https://oig.hhs.gov/oei/reports/oei-03-19-00010.pdf
[3] Visante. Reconsidering Drug Prices, Rebates, and PBMs. August 2018. https://www.pcmanet.org/wp-content/uploads/2018/08/Reconsidering-Drug-Prices-Rebates-and-PBMs-08-09-18.pdf
[4] Federal Trade Commission. Letter to Mr. Larry Good, Executive Secretary, ERISA Advisory Council, from Andrew I. Gavil, Director, Office of Policy Planning; Martin S. Gaynor, Director, Bureau of Economics; and Deborah Feinstein, Director, Bureau of Competition. August 19, 2014. https://www.ftc.gov/system/files/documents/advocacy_documents/ftc-staff-comment-erisa-advisory-council-u.s.department-labor-regarding-pharmacy-benefit-manager-compensation-fee-disclosure/140819erisaadvisory.pdf
[5] U.S. Department of Health & Human Services Office of Inspector General. Rebates for Brand-Name Drugs in Part D Substantially Reduced the Growth in Spending from 2011 to 2015 (OEI-03-19-00010). September 2019. https://oig.hhs.gov/oei/reports/oei-03-19-00010.pdf
[6] Congressional Budget Office. Incorporating the Effects of the Proposed Rule on Safe Harbors for Pharmaceutical Rebates in CBO’s Budget Projections—Supplemental Material for Updated Budget Projections: 2019 to 2029. May 2019. https://www.cbo.gov/system/files/2019-05/55151-SupplementalMaterial.pdf
[7] Government Accountability Office. Medicare Part D: Use of Pharmacy Benefit Managers and Efforts to Manage Drug Expenditures and Utilization. July 2019. https://waysandmeans.house.gov/sites/democrats.waysandmeans.house.gov/files/documents/Medicare%20Part%20D%20GAO%20Report.pdf